
SMARTIVEMAP
DIGITAL ASSESSMENT TOOL
WHEN USING SMARTIVEMAP
MAPPING
profiles and readiness to embrace Digital Transformation

FINDING
talents and the potential Digital Champions to engage

PLANNING
a Digital Academy and discovering the competence gaps
TRACKING
the improvements of the ongoing transformation processes
Do you want to do a test by yourself? Try the free version of SmartiveMap

AN OPEN PLATFORM
MANAGERS, STARTUPPERS, EXPERTS WROTE AND VALIDATED ALL THE QUESTIONS
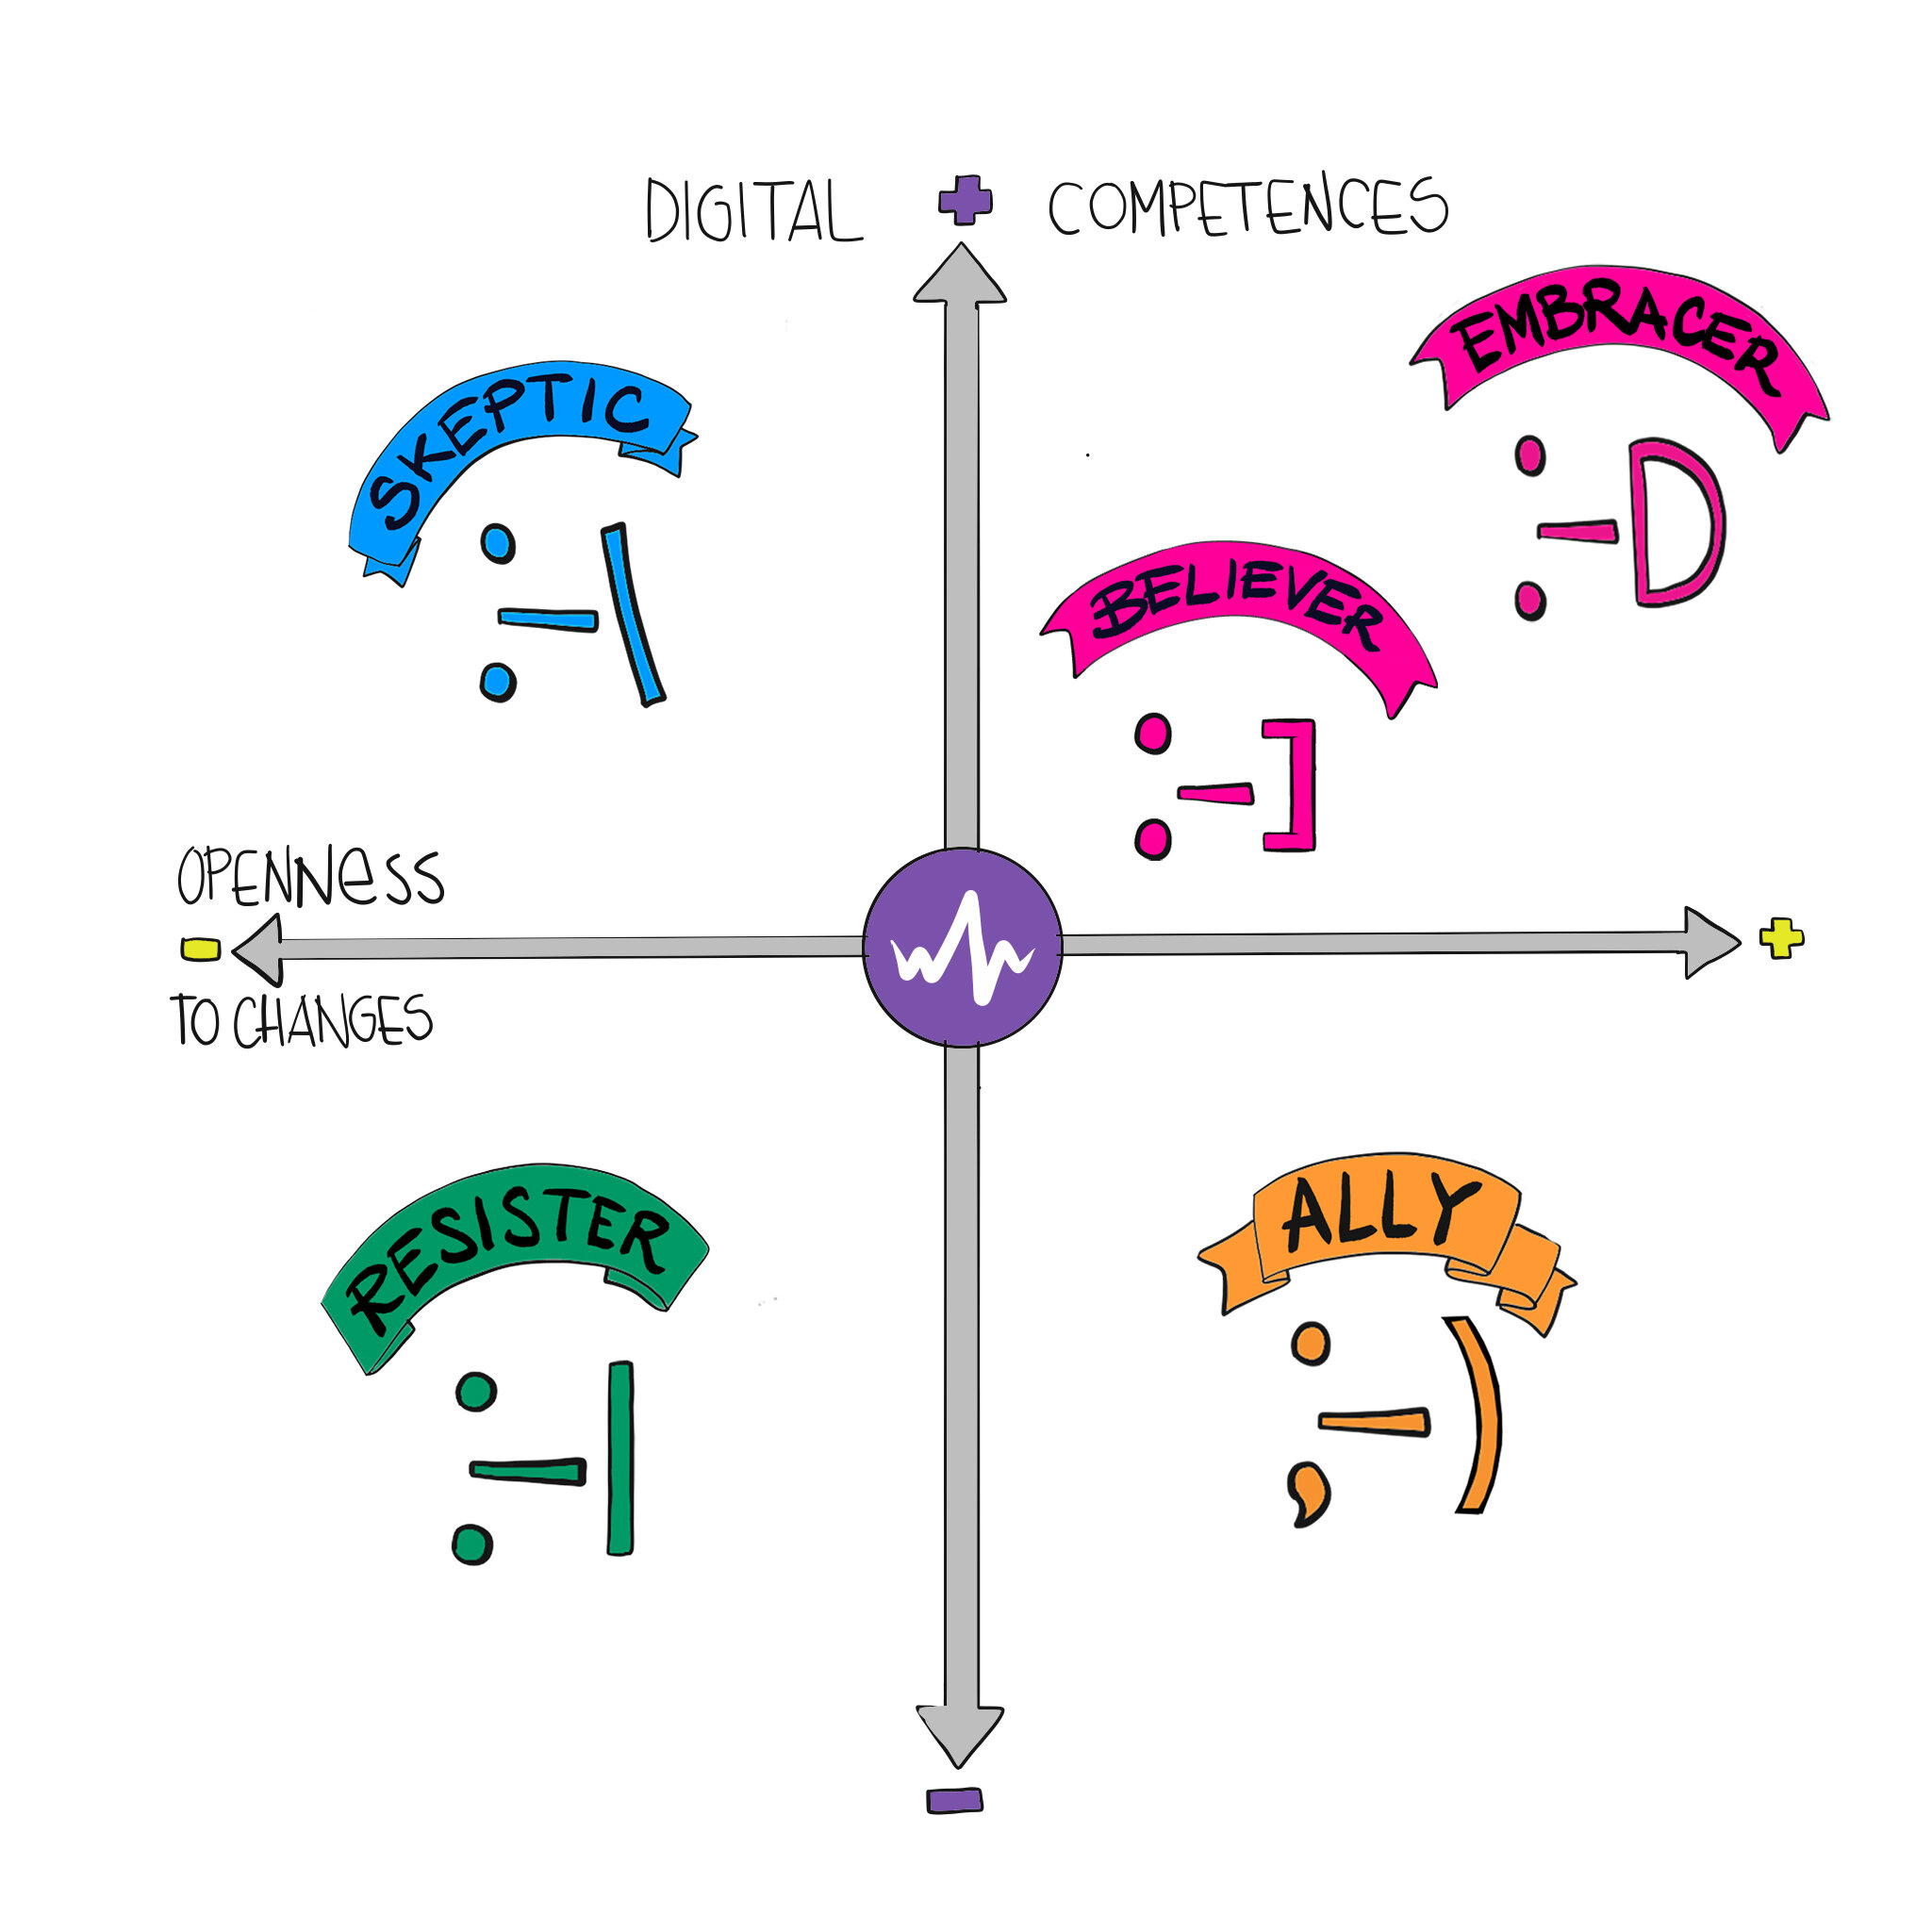
THE 5 PROFILES OF SMARTIVEMAP
Embracer: with a positive attitude towards change and a high level of Digital competences, they can play a proactive role at the beginning of the Journey
Believer: they have a good level of Openness to Change and Digital skills but still have to improve in order to become Embracers
Ally: they have a positive attitude towards change, but need to fill the gap of technical competences and digital skills
Skeptic: they already have a technical background but are hesitant about change and need to be engaged and taken on board
Resister: they are reluctant to face the Digital Change and need to be identified, carefully engaged and trained in a more advanced phase of the Journey
over 1.000 TARGETED QUESTIONS FOR ALL FUNCTIONS

Finance and controlling

Human
Resources

ICT

Marketing & Sales

Operations

Procurement
Do you want to do a test by yourself? Try the free version of SmartiveMap
PRECISION
SmartiveMap enables targeted actions of change to well defined and homogeneous groups of employees
focus
With SmartiveMap it is possible to identify the needs of people both on competence gaps and engagement

saving
SmartiveMap saves budget and resources thanks a more accurate and data driven approach
OPTIMISATION
SmartiveMap improves the effectiveness of change management, adoption or learning activities
A TOOL TO EASiLY MAP ALL THE RESOURCES OF THE ORGANISATION AND ANALYSE IN REAL TIME


AN online survey with
A final report for the user
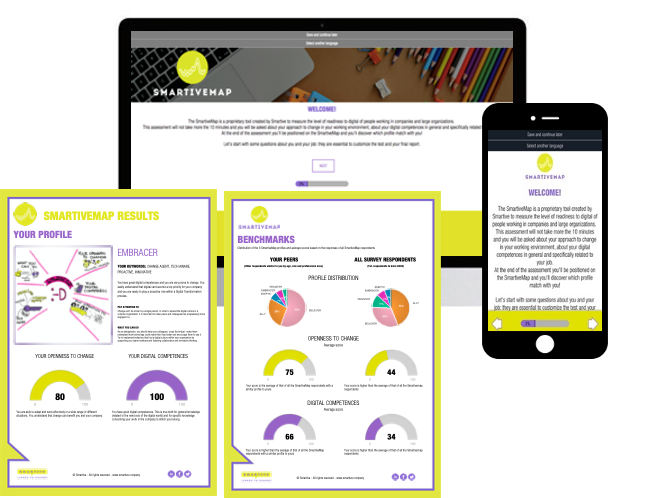
The user completes a 15-30 minute online evaluation from any device.
It is possible to save and continue at different times and eventually to view a personal report with scores and comparisons with the benchmark.

An interactive analytics Dashboard
for the company
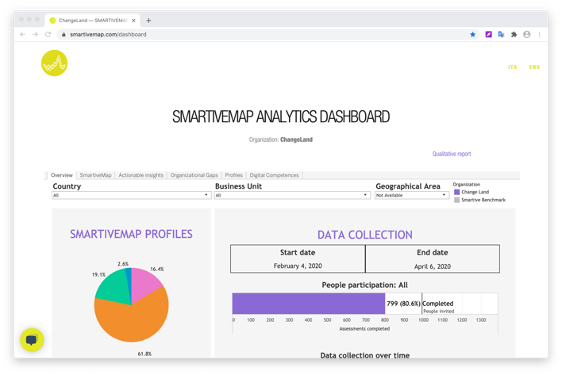
A dedicated online dashboard is activated for the company: all data and figures about the assessment and the future change activities are visualised. Many drill-downs and filters allow to very precisely identify the clusters and to get all the relevant insights for planning change.
Do you want to do a test by yourself? Try the free version of SmartiveMap
THE METRICS TO ENABLE THE DATA DRIVEN CHANGE MANAGEMENT
change attitude tracking with the smartive index
The Smartive Index is an indicator of the level of smartiveness in the organization. It is calculated according to a formula that balances the value of digital skills with that of openness to change
An organization can be said to be smartive when the average Smartive Index level is above 80

Profiles distribution in the organisation
The distribution of the 5 profiles is shown graphically on the SmartiveMap to analyse their concentration
The analysis of the profiles helps to understand how the different attitudes to digital transformation in the organization are distributed

Analysis of the competence gaps
Various types of gaps of digital skills in the organization are provided: management vs all, young vs seniors, digital competence gaps in each area, etc.
These indicators are invaluable for planning training and change actions in a very precise way
all metrics in the dashboard are compared with a benchmark of thousands of responses
Do you want to do a test by yourself? Try the free version of SmartiveMap
among the clients of SmartiveMap:


Book a demo and TRY SMARTIVEMAP for YOUR ORGanization
Be the first to experience SmartiveMap in your organization.
Make your self assessment and get a personalized report about your profile and with the market benchmarks.
Do you want to do a test by yourself? Try the free version of SmartiveMap